qEEG in Unipolar vs Bipolar Depression: Can Brain Mapping Help Differentiate the Two?
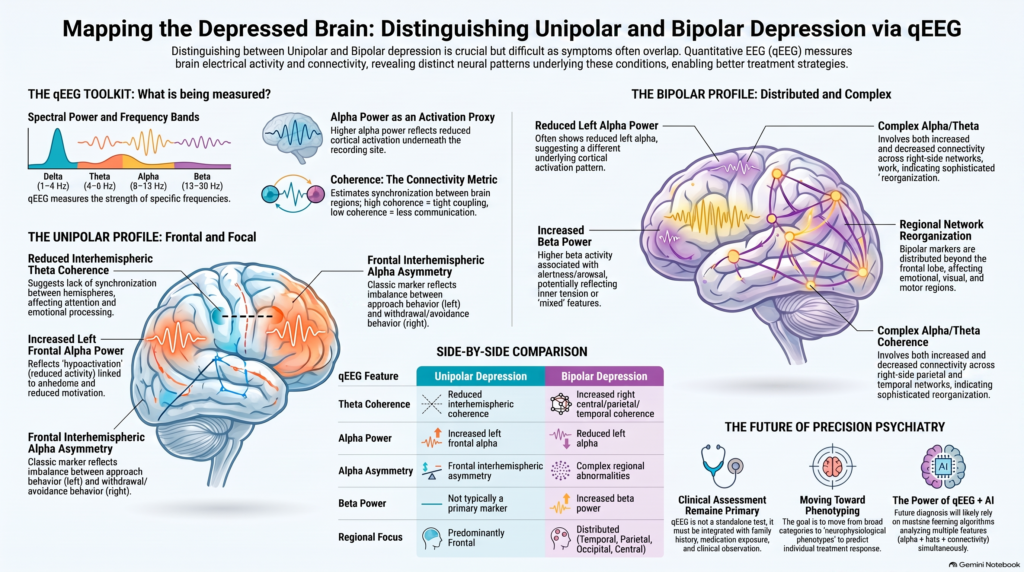 Distinguishing unipolar major depression from bipolar depression is one of the most clinically important—and sometimes difficult—tasks in psychiatry.
A patient presenting with low mood, anhedonia, sleep disturbance and impaired concentration may satisfy criteria for a depressive episode, but the underlying illness may ultimately prove to be either:
- Major Depressive Disorder (unipolar depression), or
- Bipolar Disorder presenting during its depressive phase
This distinction matters because treatment strategies, long-term prognosis and the risk of antidepressant-induced mood destabilisation can differ considerably.
Clinical history remains the foundation of diagnosis. However, quantitative electroencephalography (qEEG) is increasingly being studied as a way of examining whether unipolar and bipolar depression are associated with different patterns of cerebral electrical activity and functional connectivity.
One particularly interesting summary appears in the review The Role of Quantitative EEG in the Diagnosis of Neuropsychiatric Disorders, which presents distinct qEEG findings reported in unipolar and bipolar depressive disorders.
The findings are not yet sufficiently specific to diagnose either condition independently—but they provide a useful glimpse into how brain-network physiology may differ between depressive phenotypes.
What Does qEEG Actually Measure?
An EEG records spontaneous electrical activity generated by large populations of cortical neurons.
Quantitative EEG, or qEEG, mathematically analyses this signal and measures characteristics such as:
- spectral power
- relative and absolute frequency-band activity
- hemispheric asymmetry
- coherence between regions
- phase relationships
- network organisation
The principal frequency bands commonly examined include:
Delta: approximately 1–4 Hz
Theta: approximately 4–8 Hz
Alpha: approximately 8–13 Hz
Beta: approximately 13–30 Hz
Instead of merely looking at waveforms visually, qEEG allows clinicians and researchers to ask:
Is a particular frequency excessively strong or weak?
and
Are different parts of the brain communicating differently from what would normally be expected?
This second question—functional connectivity—may be especially relevant when comparing bipolar and unipolar depression.
qEEG Markers Reported in Unipolar Depression
The review summarises three important electrophysiological findings reported in unipolar depressive disorder:
1. Reduced interhemispheric theta coherence
2. Frontal interhemispheric alpha asymmetry
3. Increased left frontal alpha power
Each represents a slightly different aspect of brain function.
1. Reduced Interhemispheric Theta Coherence in Unipolar Depression
Coherence is a qEEG measure used to estimate the degree to which electrical activity in two brain regions is synchronised within a particular frequency band.
In very simplified terms:
High coherence
Two regions demonstrate greater synchronisation.
Low coherence
Their oscillatory activity is less tightly coupled.
The reported finding of reduced interhemispheric theta coherence in unipolar depression therefore suggests reduced synchronisation between corresponding regions of the two cerebral hemispheres within the theta frequency range.
This is interesting because theta oscillations participate in several processes relevant to depression, including:
- attention
- working memory
- cognitive control
- emotional processing
- communication between cortical and limbic networks
The finding fits with an increasingly important model of depression:
Depression may be partly a disorder of network communication rather than simply a disorder of one abnormal brain region.
2. Frontal Alpha Asymmetry
The second reported qEEG feature in unipolar depression is frontal alpha asymmetry.
This is one of the most extensively studied EEG concepts in affective neuroscience.
Alpha activity is especially important because greater alpha power is often interpreted as reflecting relatively reduced cortical activation underneath the recording site.
Therefore, differences in alpha activity between the left and right frontal cortex can potentially provide information about differences in frontal functional activation.
The classic model relates:
Left frontal activity
to approach behaviour, reward seeking and behavioural activation.
Right frontal activity
more strongly to withdrawal and avoidance behaviour.
Depression frequently involves:
- reduced motivation
- anhedonia
- behavioural withdrawal
- reduced reward responsiveness
This helped generate the hypothesis that some depressed individuals demonstrate relative left frontal hypoactivation.
qEEG may represent this pattern as altered frontal alpha asymmetry.
3. Increased Left Frontal Alpha Power
The table specifically reports increased left frontal alpha power in unipolar depression.
Because alpha power and underlying cortical activation are often inversely related, increased left frontal alpha may correspond to:
relatively reduced left frontal cortical activation.
Clinically, this is interesting in relation to symptoms such as:
- anhedonia
- reduced initiative
- loss of motivation
- reduced reward-directed behaviour
- psychomotor slowing
But this relationship should not be interpreted deterministically.
A patient with increased left frontal alpha does not automatically have depression, and a patient with depression may not necessarily demonstrate this pattern.
The review itself cautions that frontal alpha asymmetry has limited diagnostic value when used alone.
qEEG Markers Reported in Bipolar Depression
The pattern described for bipolar depression is considerably more complex.
Reported findings include:
Reduced left alpha power
Increased beta power
Regional increases in alpha activation involving the right temporal regions, left occipital region and right precentral gyrus
Reduced alpha coherence in right frontal and central regions
Increased alpha coherence in right parietal and temporal regions
Increased theta coherence in right central, parietal and temporal regions
This immediately suggests an important difference.
Whereas the unipolar pattern described in the table is dominated by frontal asymmetry and reduced theta connectivity, bipolar depression demonstrates a more distributed combination of:
power abnormalities + regional activation differences + altered connectivity.
1. Reduced Left Alpha Power in Bipolar Depression
One reported feature in bipolar depressive disorder is reduced left alpha power.
This is particularly interesting because it is directionally different from the increased left frontal alpha described in unipolar depression.
If alpha power is treated as inversely related to cortical activation:
More alpha → less underlying activation
whereas
Less alpha → relatively greater activation
then reduced left alpha in bipolar depression may suggest a different pattern of cortical activation compared with the left-frontal hypoactivation model traditionally associated with unipolar depression.
This distinction raises the possibility that apparently similar depressive symptoms may arise from different network states.
2. Increased Beta Power in Bipolar Depression
The review also reports increased beta power in bipolar depression.
Beta frequencies are generally associated with:
- alertness
- active cortical processing
- cognitive engagement
- sensorimotor activity
Increased beta therefore raises interesting questions regarding cortical arousal and activation in bipolar depression.
Clinically, bipolar depressive episodes can sometimes include features such as:
- inner tension
- racing thoughts
- agitation
- mixed depressive symptoms
- sleep disturbance
- heightened activation despite depressed mood
It is tempting to relate increased beta to these features, but this remains an inference rather than a diagnostic rule.
Beta activity is also highly susceptible to:
- muscle tension
- jaw activity
- forehead contraction
- medications
- caffeine
- anxiety
Therefore, artifact control is particularly important when interpreting beta abnormalities.
3. Regional Alpha Activation in Bipolar Depression
The review reports increased alpha-related activation involving:
- the right inferior temporal region
- the right superior temporal region
- the left occipital lobe
- the right precentral gyrus
This distribution is striking because it extends well beyond the frontal cortex.
It reinforces the concept that bipolar disorder involves distributed brain networks, rather than one abnormal frontal location.
Different regions contribute to different aspects of behaviour:
Temporal regions
participate in emotional processing, memory and higher-order sensory integration.
Occipital regions
primarily participate in visual processing but also form part of larger cortical networks.
Precentral regions
are strongly involved in motor organisation.
These observations may be relevant to the broader clinical phenotype of bipolar disorder, in which mood, cognition, psychomotor activity and arousal can fluctuate considerably across mood states.
Connectivity May Be Even More Interesting Than Power
Perhaps the most intriguing bipolar findings in the table are not simply changes in alpha or beta power.
They are changes in coherence.
The review describes:
Reduced alpha coherence
in the right frontal and central regions
but
Increased alpha coherence
in the right parietal and temporal regions
and
Increased theta coherence
in the right central, parietal and temporal regions.
This indicates that bipolar depression may involve regional reorganisation of network synchronisation.
Some networks appear less coupled.
Others appear more strongly coupled.
This is considerably more sophisticated than the idea of simply having “too much theta” or “too little alpha.”
What Does Increased Coherence Mean?
An important point:
Increased coherence is not automatically better.
Brain function depends upon the appropriate balance between:
integration
and
segregation.
Different brain areas need to communicate, but they also need to maintain specialised functions.
Excessively high connectivity may indicate that two areas are behaving too similarly or that normal network differentiation has been disturbed.
Conversely, abnormally low coherence may suggest insufficient coordination.
Therefore, the bipolar findings may reflect abnormal network organisation rather than simply increased or decreased activity.
Unipolar Versus Bipolar Depression: A qEEG Comparison
The pattern summarised in the review can be conceptualised as follows:
| qEEG Feature | Unipolar Depression | Bipolar Depression |
|---|---|---|
| Theta coherence | Reduced interhemispheric coherence | Increased right central/parietal/temporal coherence |
| Alpha power | Increased left frontal alpha | Reduced left alpha |
| Alpha asymmetry | Frontal interhemispheric asymmetry | More complex regional alpha abnormalities |
| Alpha coherence | — | Reduced right frontal/central, increased right parietal/temporal |
| Beta power | — | Increased beta |
| Regional pattern | Predominantly frontal findings | More distributed temporal, parietal, occipital and central findings |
This summary comes directly from the qEEG markers described in the review’s comparison of unipolar and bipolar depressive disorder.
Why This Matters Clinically
A depressive episode can look almost identical whether it occurs in major depressive disorder or bipolar disorder.
The diagnostic distinction often depends on detecting evidence of:
- previous hypomania or mania
- episodic mood elevation
- reduced need for sleep
- increased goal-directed behaviour
- impulsivity
- family history of bipolar disorder
- early age of onset
- recurrent depressive episodes
- antidepressant-associated activation
- mixed symptoms
Unfortunately, patients may not spontaneously recognise or report previous hypomanic episodes.
This creates an attractive potential role for objective biomarkers.
If qEEG eventually demonstrates reproducible electrophysiological differences between the two disorders, it may become useful as an additional layer of evidence.
But we are not yet at the stage where a brain map can replace careful clinical assessment.
qEEG Should Not Be Used as a “Bipolar Test”
The table is scientifically interesting, but it should not be interpreted as:
Increased beta = bipolar disorder.
or:
Increased left frontal alpha = unipolar depression.
The research literature contains substantial overlap between psychiatric disorders and between individual patients.
The same review emphasises that qEEG measurements are affected by:
- age
- biological variability
- level of wakefulness
- equipment
- electrode characteristics
- medication exposure
- artifacts
- analytical methodology
and concludes that qEEG should provide additional objective information alongside other investigations rather than immediately establish psychiatric diagnosis.
Brain Mapping Should Move Beyond Colour Maps
A major problem with popular descriptions of qEEG is the excessive emphasis on colourful topographical images.
A brain map showing a red area does not mean:
“This area is diseased.”
The colour merely represents the value of a particular mathematical variable.
A sophisticated depression qEEG analysis should therefore examine more than visual colour patterns.
Potentially relevant measures include:
Spectral Power
How much delta, theta, alpha and beta activity is present?
Asymmetry
Is one hemisphere behaving differently from the other?
Coherence
How strongly are different cortical regions synchronised?
Regional Distribution
Where are abnormalities concentrated?
Network Pattern
Do several abnormalities form a coherent physiological phenotype?
The value of qEEG comes from integrating these measurements, not from looking for one red or blue patch.
Depression May Need qEEG Phenotyping Rather Than qEEG Diagnosis
Perhaps the most useful future role for qEEG is not simply:
“Does the patient have depression?”
That question can usually be answered clinically.
A potentially more valuable question is:
“What neurophysiological subtype of depression does this patient demonstrate?”
One patient might demonstrate:
Frontal hypoactivation phenotype
Another:
Abnormal theta-connectivity phenotype
Another:
High-arousal/beta phenotype
Another:
Distributed bipolar-type connectivity phenotype
Another:
No major resting qEEG abnormality
These are not yet formally established qEEG diagnostic subtypes.
But this way of thinking may eventually be more clinically useful than attempting to force every depressed patient into one EEG pattern.
qEEG, Bipolarity and Precision Psychiatry
The larger implication of these findings is that psychiatric diagnoses may represent clinical syndromes containing multiple biological subtypes.
Two patients can have the same depression score while showing very different:
- electrophysiology
- cognition
- sleep architecture
- treatment response
- illness course
This is why psychiatry is increasingly moving toward:
clinical phenotype + cognitive phenotype + neurophysiological phenotype
rather than relying solely on symptom counts.
Can qEEG Help Select Treatment?
This remains an active research area.
Investigators have studied EEG-derived measures including:
- alpha asymmetry
- theta activity
- cordance
- connectivity
- treatment-emergent EEG changes
as potential predictors of antidepressant response.
The same review, however, concluded that qEEG evidence was not sufficiently established to routinely select antidepressant treatment based on qEEG findings alone.
Therefore a clinician should not currently tell a patient:
“Your brain map says you need this particular antidepressant.”
Treatment still depends primarily on:
- accurate diagnosis
- bipolarity assessment
- previous response
- family history
- comorbid conditions
- tolerability
- medication safety
- course of illness
qEEG may eventually add another level of information, but it does not replace these fundamentals.
qEEG May Be Particularly Interesting in Diagnostic Uncertainty
Brain mapping may have greater relevance when the question is not:
“Does this patient feel depressed?”
but rather:
“What type of depressive illness might this represent?”
Potential situations include:
- recurrent depression beginning early in life
- strong family history of bipolar disorder
- antidepressant-induced activation
- atypical depression
- mixed depressive symptoms
- episodic changes in energy
- treatment-resistant depression
- inconsistent treatment response
In such cases, electrophysiological data might eventually contribute another objective dimension to an already detailed clinical evaluation.
A Better Assessment Model
For difficult depressive presentations, the most scientifically sound model is:
Detailed psychiatric assessment
↓
Depression severity measurement
↓
Careful evaluation for bipolarity
↓
Sleep, substance and medication assessment
↓
Cognitive assessment where necessary
↓
qEEG / brain mapping where clinically useful
↓
Integrated interpretation
Rather than:
qEEG → diagnosis.
What Is Particularly Interesting About This Table?
The most important message from the qEEG comparison is not that one specific marker diagnoses bipolar disorder.
It is that unipolar and bipolar depression may represent measurably different network states despite producing superficially similar depressive symptoms.
In the review:
Unipolar depression
is characterised particularly by:
frontal alpha abnormalities + reduced interhemispheric theta coherence
while:
Bipolar depression
shows a broader combination of:
alpha abnormalities + increased beta + regionally increased and decreased connectivity.
That distinction makes physiological sense.
Bipolar disorder is fundamentally characterised not merely by depression, but by instability of mood, activation and brain-state regulation across time.
It is therefore plausible that network-level electrophysiological differences may ultimately help characterise bipolarity.
The challenge is converting these research observations into reliable individual-level biomarkers.
The Future: qEEG + AI Rather Than One EEG Marker
Modern qEEG generates enormous amounts of information.
For every electrode, algorithms can calculate:
- absolute power
- relative power
- frequency ratios
- coherence
- phase
- asymmetry
- entropy
- connectivity
- network characteristics
Trying to interpret these manually using one parameter at a time may miss complex patterns.
The future will likely involve machine-learning analysis of multiple electrophysiological features simultaneously.
Rather than asking:
Is alpha high?
an algorithm may analyse:
alpha + theta + beta + regional distribution + asymmetry + connectivity + cognitive performance + clinical phenotype
to estimate whether a patient’s neurophysiological profile more closely resembles one psychiatric phenotype or another.
This is where qEEG could become particularly powerful.
qEEG Brain Mapping for Depression in Chennai
The clinical value of brain mapping lies in adding objective neurophysiological information to a careful psychiatric assessment, not in replacing clinical judgement with an automated colour map.
In complex depressive presentations—particularly when recurrent depression, treatment resistance, mixed symptoms or possible bipolarity are present—assessment can incorporate:
**Detailed diagnostic interview
- Standardised depression assessment
- Structured bipolarity evaluation
- Cognitive testing when indicated
- qEEG / brain mapping
- Integrated interpretation**
The objective is to move toward a more measurement-based and biologically informed model of psychiatry.
Frequently Asked Questions
Can qEEG distinguish bipolar depression from unipolar depression?
Research demonstrates group-level differences, including different alpha, theta, beta and coherence patterns. However, qEEG is not currently sufficiently specific to establish the distinction independently in an individual patient.
What qEEG pattern is reported in unipolar depression?
The reviewed literature reports reduced interhemispheric theta coherence, frontal alpha asymmetry and increased left frontal alpha power.
What qEEG abnormalities are reported in bipolar depression?
Reported abnormalities include reduced left alpha power, increased beta power and regional changes in alpha and theta coherence, particularly involving right frontal, central, parietal and temporal networks.
Does increased beta mean bipolar disorder?
No. Beta activity can be influenced by arousal, anxiety, medications and muscle artifacts. It must be interpreted together with the remainder of the EEG and the clinical presentation.
Is frontal alpha asymmetry diagnostic of depression?
No. It is one of the most extensively studied electrophysiological markers in depression, but its diagnostic specificity is limited. The review itself notes that its role is more promising for understanding prognosis and neurophysiology than as an isolated diagnostic tool.
Can qEEG tell which antidepressant to prescribe?
Not reliably at present. qEEG-derived biomarkers of treatment response remain an important research area, but available evidence does not support choosing routine psychiatric treatment solely on the basis of qEEG.
Brain Mapping and Precision Assessment of Depression
Dr. Srinivas Rajkumar T
MBBS (Madurai Medical College), MD (AIIMS New Delhi), DNB, MBA (BITS Pilani)
Senior Consultant Psychiatrist
Apollo Clinic, Velachery, Chennai
Opposite Phoenix Marketcity
My approach is based on diagnosis-first psychiatry with objective assessment where it genuinely adds clinical information.
qEEG should not be advertised as a machine that simply identifies “bipolar” or “unipolar” brains.
Its real potential is considerably more interesting:
Two patients may look equally depressed clinically, yet their underlying brain-network physiology may not be the same.
Understanding those differences is one of the pathways through which psychiatry may eventually move from broad diagnostic categories toward individual neurophysiological phenotyping and precision treatment.
Reference
Popa LL, Dragos H, Pantelemon C, Rosu OV, Strilciuc S. The Role of Quantitative EEG in the Diagnosis of Neuropsychiatric Disorders. J Med Life. 2020;13(1):8–15. doi:10.25122/jml-2019-0085.